Table of contents
1. Introduction
The AI Deal Index is a scoring system that measures companies’ ability to survive and thrive given the risks from frontier labs’ and hyperscalers’ AI offerings and from competitors using AI to compete faster.
This work builds on Sema’s experience evaluating 2,700 technology organizations and $2.7T of enterprise value over the last 9 years for the world’s top investors and operators.
Specifically, each company is evaluated against 29 dimensions that are grouped into five categories, which cover the business’s technology, its overall business, and the market it operates in.
This report includes scores for 511 companies that underwent transactions between August and October 2026. The AI Deal Index uses only outside-in, publicly available information. Buyers and sellers include private equity (PE) funds, fund-owned platform companies and strategic buyers; a table of terms is in Finding 3. The scores are percentiles, and higher is better. A company scoring 83 means it scored at or above 83% of the 511.
Methodology details and company inclusion criteria are included below.
2. Executive Summary
This whitepaper has six findings.
Finding 1. Companies that sell a product score higher than companies that sell services.
Finding 2. Vertical operating software has the strongest AI Defensibility scores; information technology services the weakest.
Finding 3. Funds buying directly pick the most defensible companies.
Finding 4. Control buyouts sit far above add-ons.
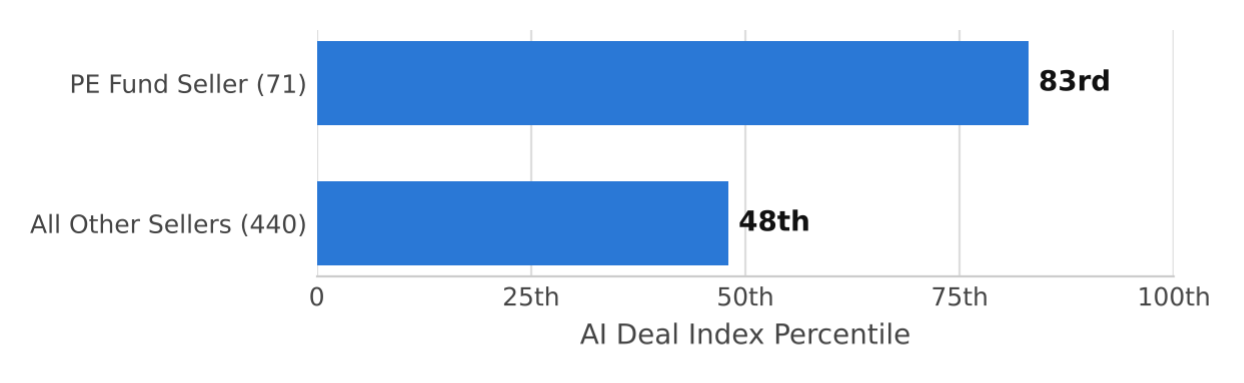
Finding 5. Companies sold by PE funds score higher than companies sold by others.
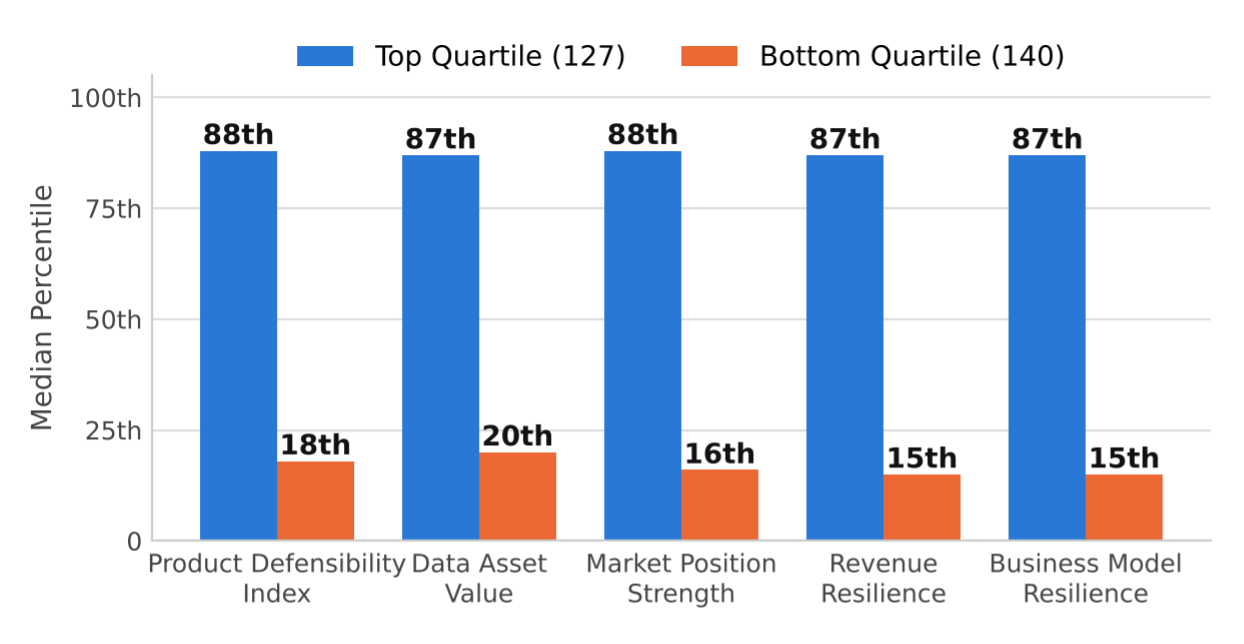
Finding 6. The most defensible companies lead on all five categories, not on one.
3. Finding 1. Companies that sell a product score higher than companies that sell services.
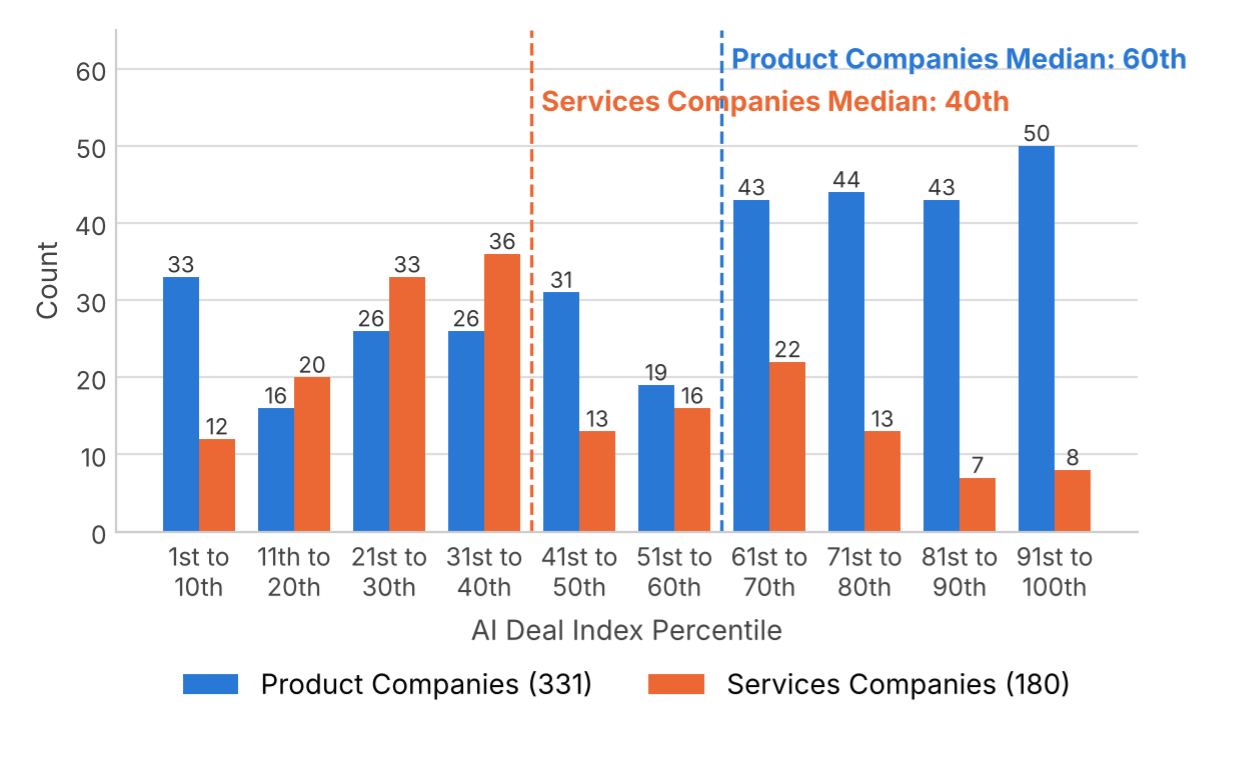
Of the 511 companies, 331 are product companies: they sell software or data. 180 are services.
Findings: Product companies have significantly higher overall AI Defensibility scores, 60th percentile vs. 40th.
In addition, the distribution is wider for product companies. Services companies cluster: 38% sit between the 21st and the 40th percentile, vs. 16% of product companies. 15% of product companies sit in the top tenth of the index, vs. 4% of services companies.
Areas for future research: why services companies cluster. One hypothesis: human-delivered workflows cap both the upside and the downside — a services firm is hard to make much more defensible and hard to make much less.
4. Finding 2. Vertical operating software has the strongest AI Defensibility scores; information technology services the weakest.
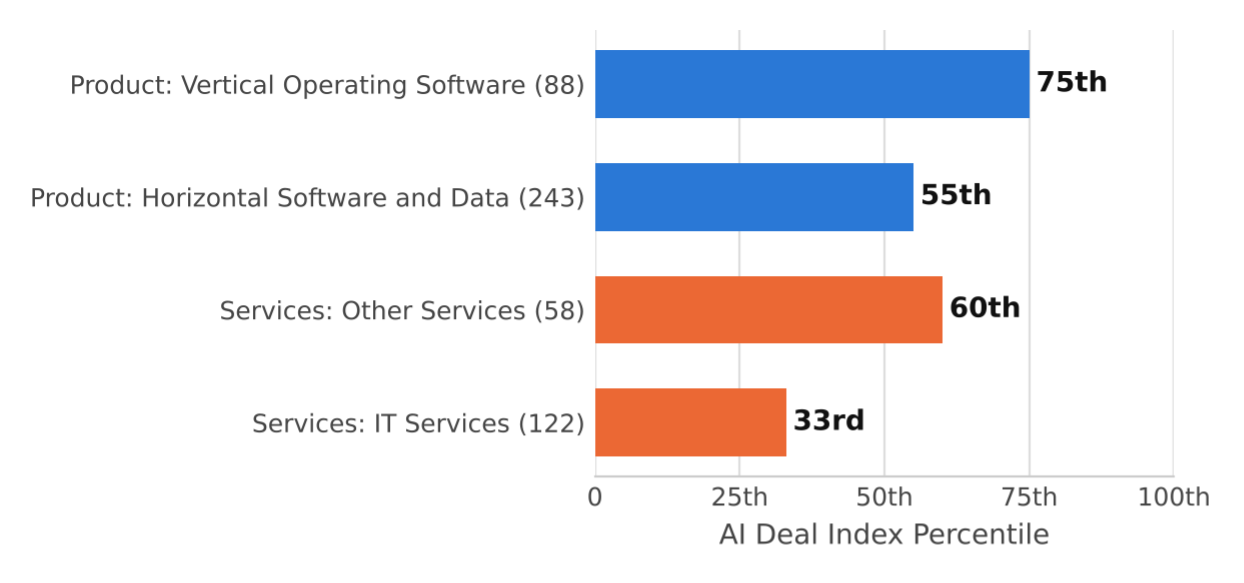
Those product and services companies can be further broken into vertical vs. horizontal technology companies (88 and 243 of the 331), and IT services vs. other services companies (122 and 58 of the 180).
Findings: vertical operating software companies have the strongest scores, 75th percentile. Horizontal technology companies: 55th. Other services: 60th.
The pattern holds inside every end market with 10 or more vertical software companies: healthcare, industrial, transport, real estate, financial services, with medians from the 68th to the 86th percentile.
IT services have the most AI disruption risk, 33rd.
These results represent a quantification of the qualitative observation of the strength of vertical SaaS.
5. Finding 3. Funds buying directly pick the most defensible companies.
The 511 transacted companies can also be grouped by type of buyer: PE fund, buying directly (n = 94), fund-owned platform company (168), strategic buyer, publicly listed (96), and strategic buyer, independent (not fund-owned) (153).
Findings: PE funds buying directly bought companies with the highest AI Defensibility, 83rd percentile. This is significantly higher than the defensibility of their platform companies’ add-ons, 48th.
This is to be expected: a platform buys add-ons for what they add to the platform, not for their standalone defensibility.
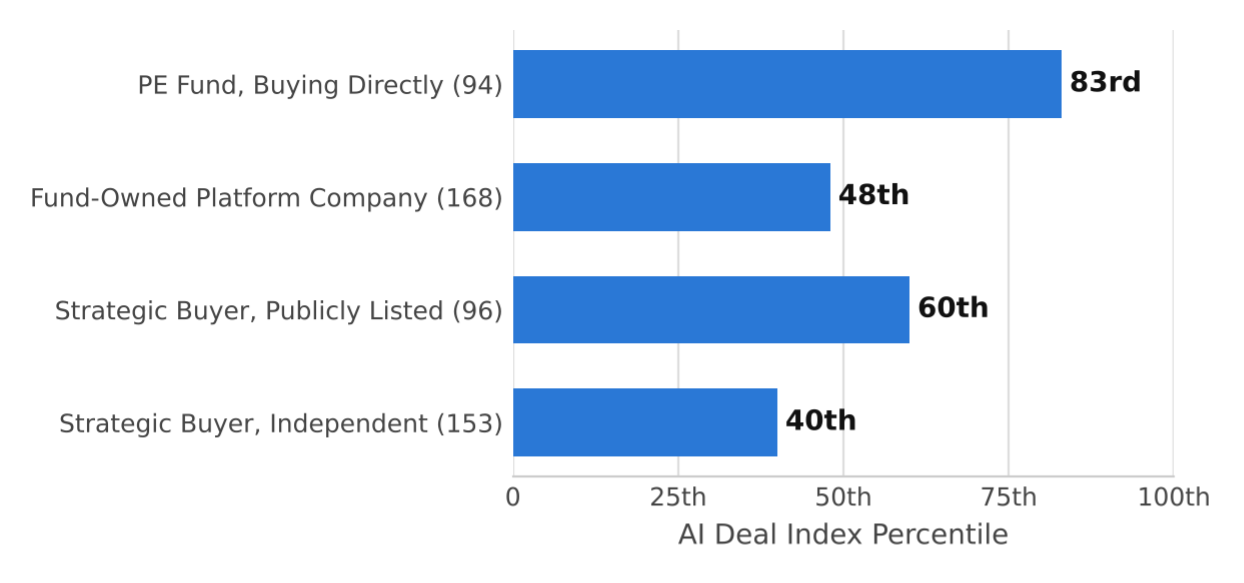
Areas for future research: the drivers of the differences among the three other buyer types – fund-owned platforms (48th), listed strategics (60th), independent strategics (40th).
6. Finding 4. Control buyouts sit far above add-ons.
The companies can also be grouped by type of deal.
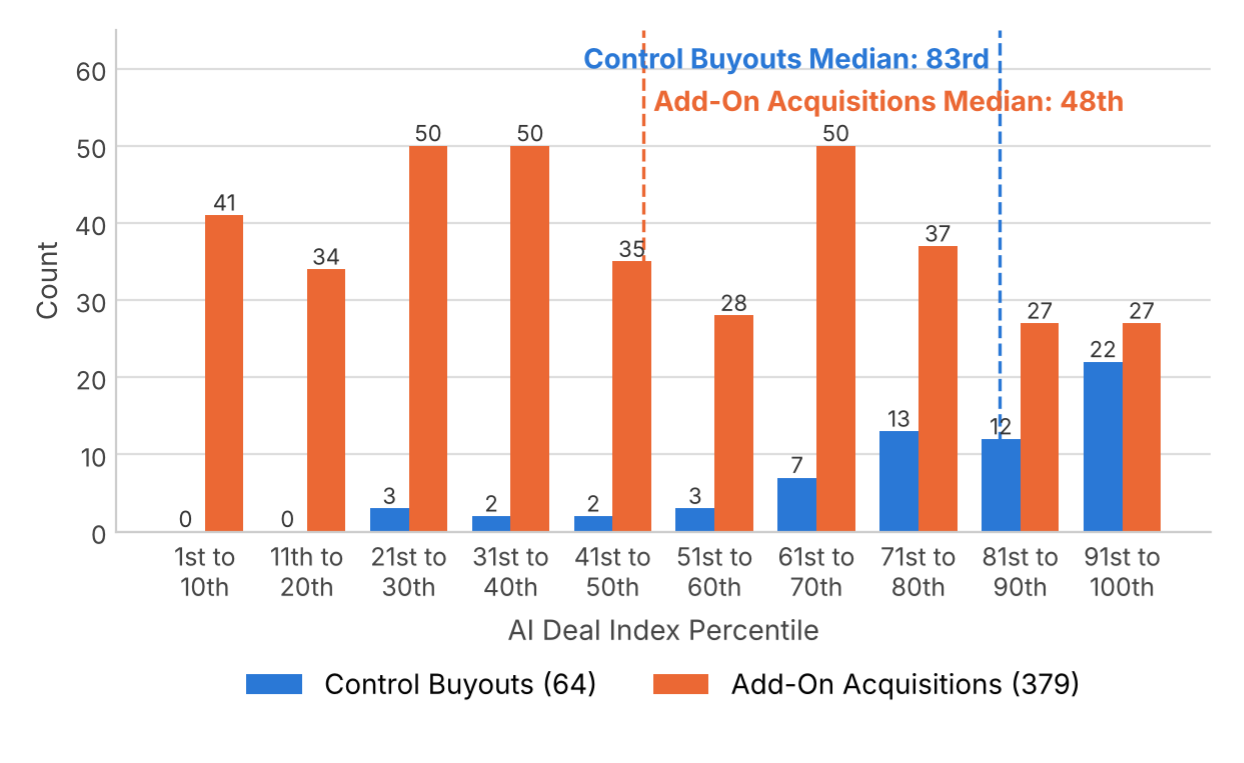
Of the 511 companies, 379 are add-on acquisitions, and 64 are control buyouts (443 companies in total). The remaining 68 are 41 divestitures and 27 growth or minority rounds, not analyzed in this section.
Findings:
Control buyouts sit at the 83rd percentile of the AI Deal Index. Add-on acquisitions sit at the 48th.
A control buyout is 5 times as likely as an add-on to land in the top tenth of the index.
This too is expected: as discussed above, an add-on is bought for what it adds to the platform that owns it.
Less expected is the long tail of control buyouts: 8% of them sit below the 40th percentile of the index, and 27% at the 70th percentile or lower.
Areas for future research: whether the lower-scoring control buyouts were bought at lower valuations.
7. Finding 5. Companies sold by PE funds score higher than companies sold by others.
In addition to buyer (see above), deals can be grouped by seller.
Of the 511, 71 had a PE fund seller, 440 did not.
Findings: companies sold by PE funds score significantly higher, 83rd percentile vs. 48th.
Areas for future research: whether PE fundownership builds defensibility during the hold or selects for it at entry.
8. Finding 6. The most defensible companies lead on all five categories, not on one.
Another tested hypothesis was the characteristics of the highest- vs. lowest-scoring companies. For example, are the strongest companies more defensible because of a “spike” in data value, or market position?
Findings: the 127 companies in the top quartile are significantly more defensible than the 140 in the bottom quartile, on every one of the five categories.
On each of the five AI Deal Index categories, the median top-quartile company sits at the 87th or 88th percentile. The median bottom-quartile company sits at the 15th to the 20th.
No category carries the result alone: the gap is 67 to 72 percentile points on each of the five. A strong company is strong across the board, not spiked.
Areas for future research: whether any category leads the others over time — a rising Data Asset Value before the rest moves, for example.
9. Methodology and Inclusion Criteria
Population.
584 companies were in deals announced August 1 to October 31, 2026, sourced from a commercial deal database.
55 were excluded for business type, such as physical businesses, banks and insurers.
18 were excluded for deal type, such as minority stakes under the control line, mergers between companies owned by the same PE fund, or deals announced before the window.
After these exclusions, 511 companies are in the AI Deal Index.
Scoring.
Each company was scored on 29 dimensions in five categories, listed above, by Sema's AI Deal Index engine.
All results are based on outside-in analysis only: no access to internal company data or management interviews.
The 511 companies were compared via percentiles. Companies’ percentile scores can change due to additional companies being added to the comparison set, internal improvements, M&A, or changes in market conditions.


