2,700
companies analyzed
AI Adoption
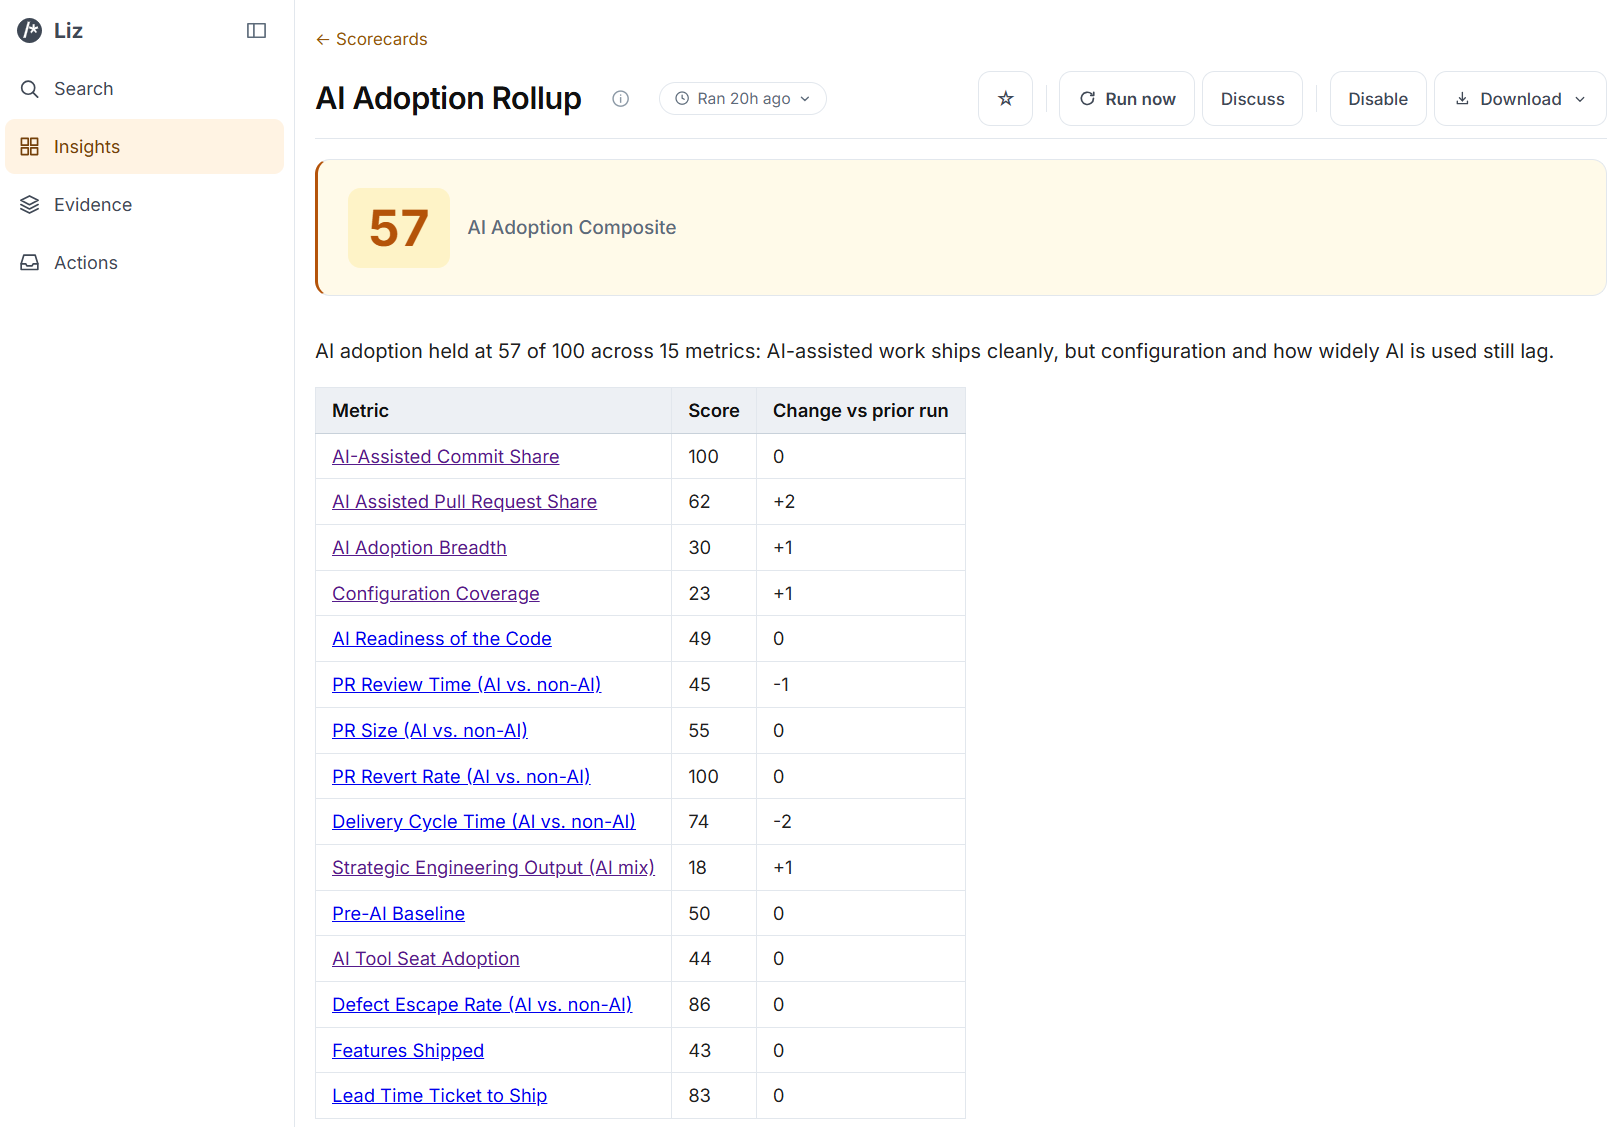
Liz connects to source control and shows where AI is in use, how AI work compares to non-AI work, and what that means for the business. Folks are using it for AI adoption and impact, keeping roadmaps on track, and automating board reports.


Built on experience
companies analyzed
in enterprise value
AI adoption metrics in one model
metrics from source control alone
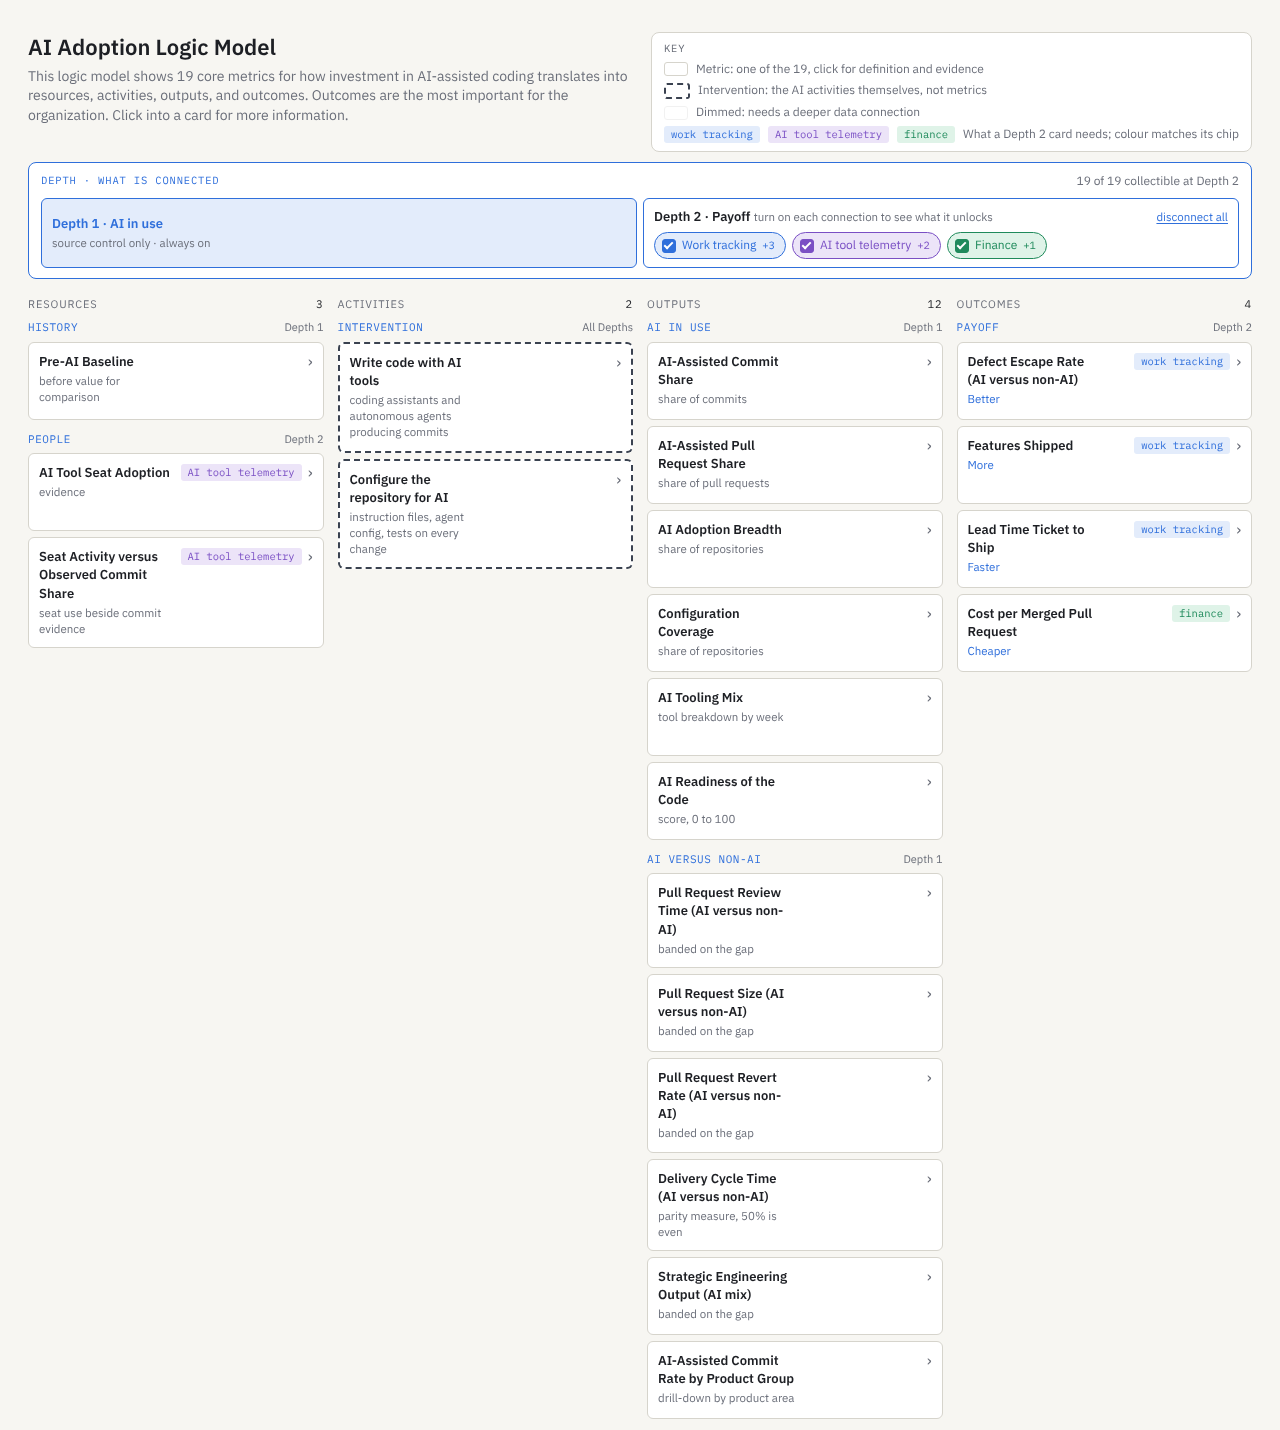
The logic model
19 metrics, read left to right. Resources are what the organization brings. Activities are what AI changes. Outputs are what the work produces. Outcomes are what the organization gets, and they matter most.

3 metrics: the pre-AI baseline, AI tool seat adoption, and seat activity versus observed commits.

Writing code with AI tools, and setting up the repository for AI. These are the intervention, not metrics.

12 metrics. AI in use: share of commits and pull requests, breadth, tooling and readiness. AI versus non-AI: review time, size, reverts and cycle time.

4 metrics: defect escape rate, features shipped, lead time from ticket to ship, and cost per merged pull request. Each is measured against the pre-AI baseline.
Example · anonymized
From 30 minutes of setup.
of committed code is AI-assisted.
pull requests.
more features shipped, counted in the work tracker.
change in the regression rate.
Two depths
Depth is about data access, not performance. A Depth 1 organization can score well on every metric it collects.
Source control only. Always on. 13 of the 19 metrics: where AI is used, and how AI work compares to non-AI work.
6 more metrics, including all 4 outcomes. Work tracking adds 3, AI tool telemetry 2, finance 1.
Beyond engineering
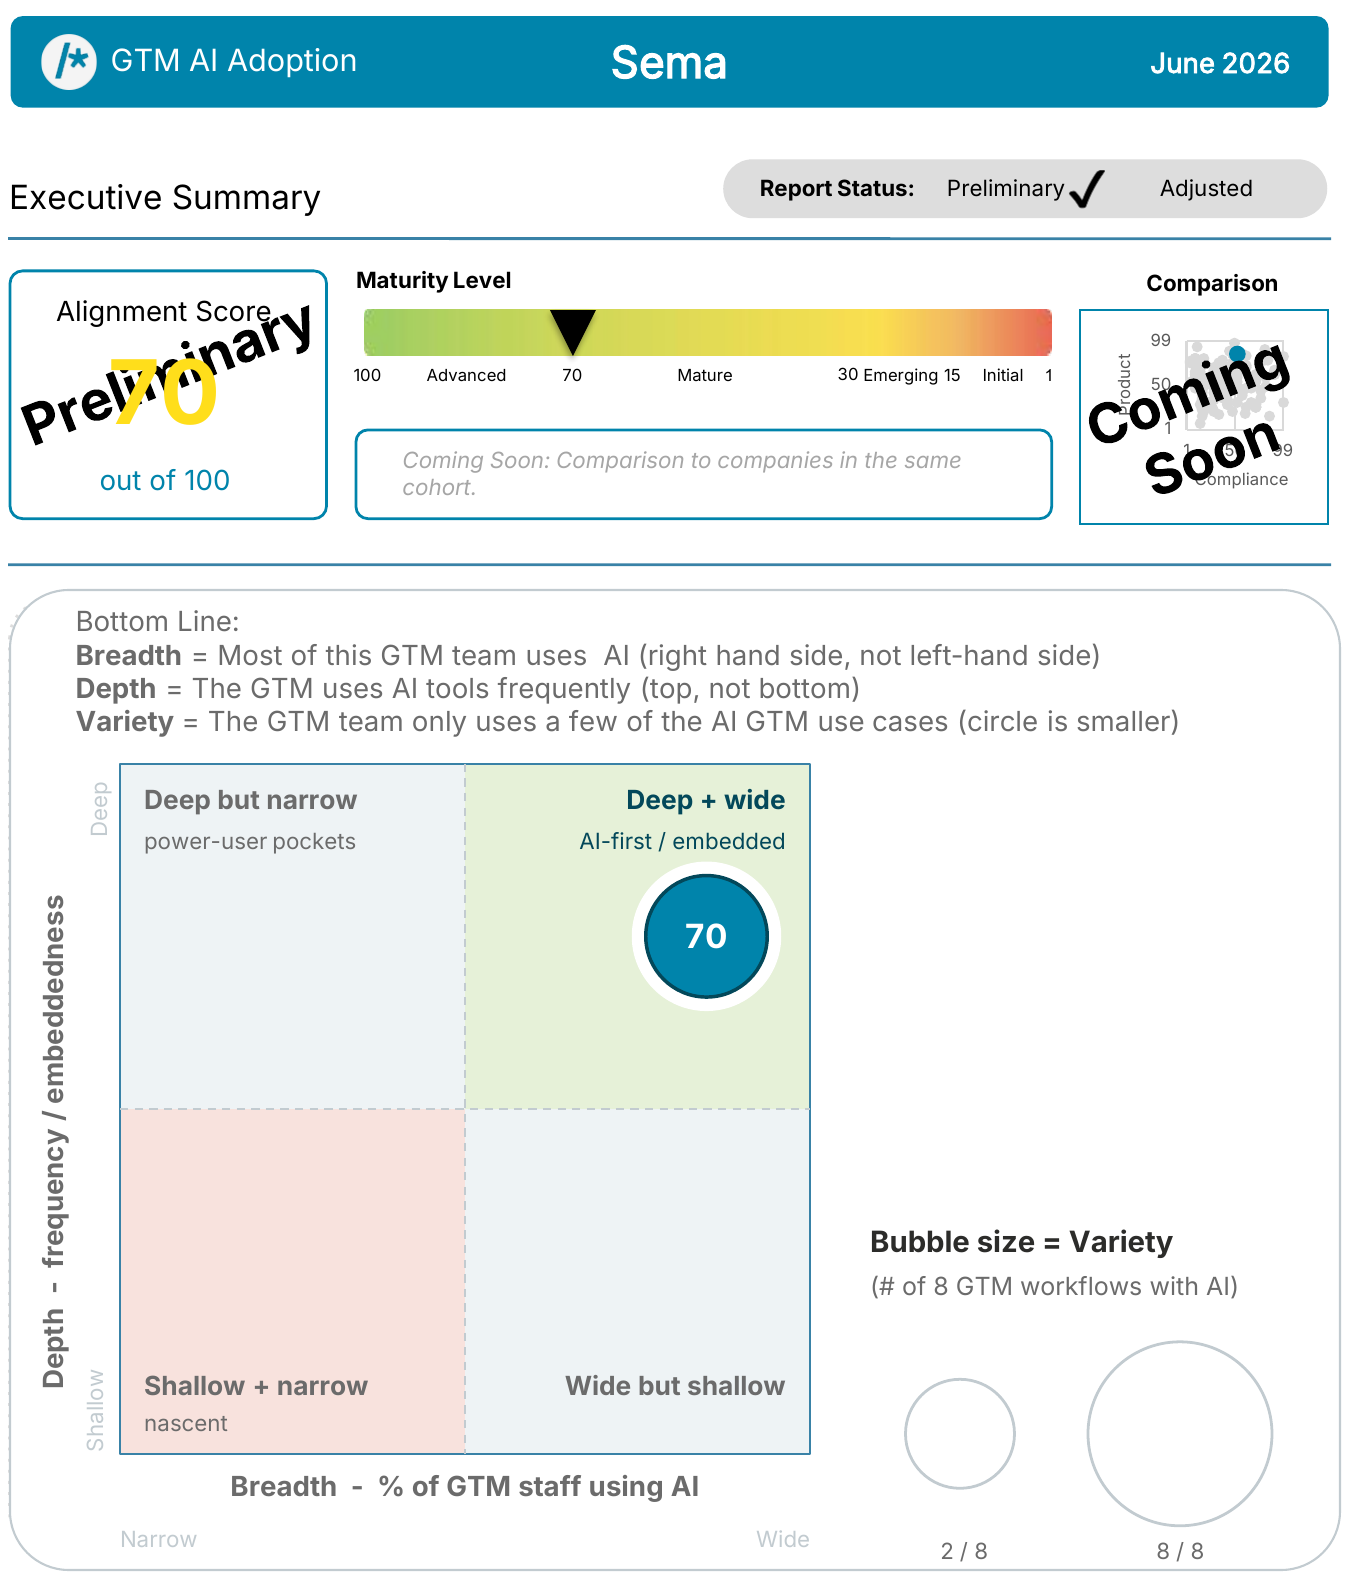
See how broadly and frequently go-to-market teams use AI, and the variety of workflows it supports. The report gives sales, marketing and customer-success leaders a shared view of adoption.
How it works
Liz reads your history to set the pre-AI baseline.
13 metrics fill in: AI in use, and AI versus non-AI.
Work tracking, AI tool telemetry and finance unlock the other 6, including all 4 outcomes.
Questions
No. Liz reports at the team level, never the individual.
Read access to source control. Everything else is optional.
Yes. Folks use Liz to automate board reports on AI adoption and impact.
Get started
Connect source control and we will walk you through the result live.


